- STAGE:
- Recently Released
- RELATED ANNOUNCEMENTS:
Tracker Report Drill-Down for Range-Type Distribution Charts
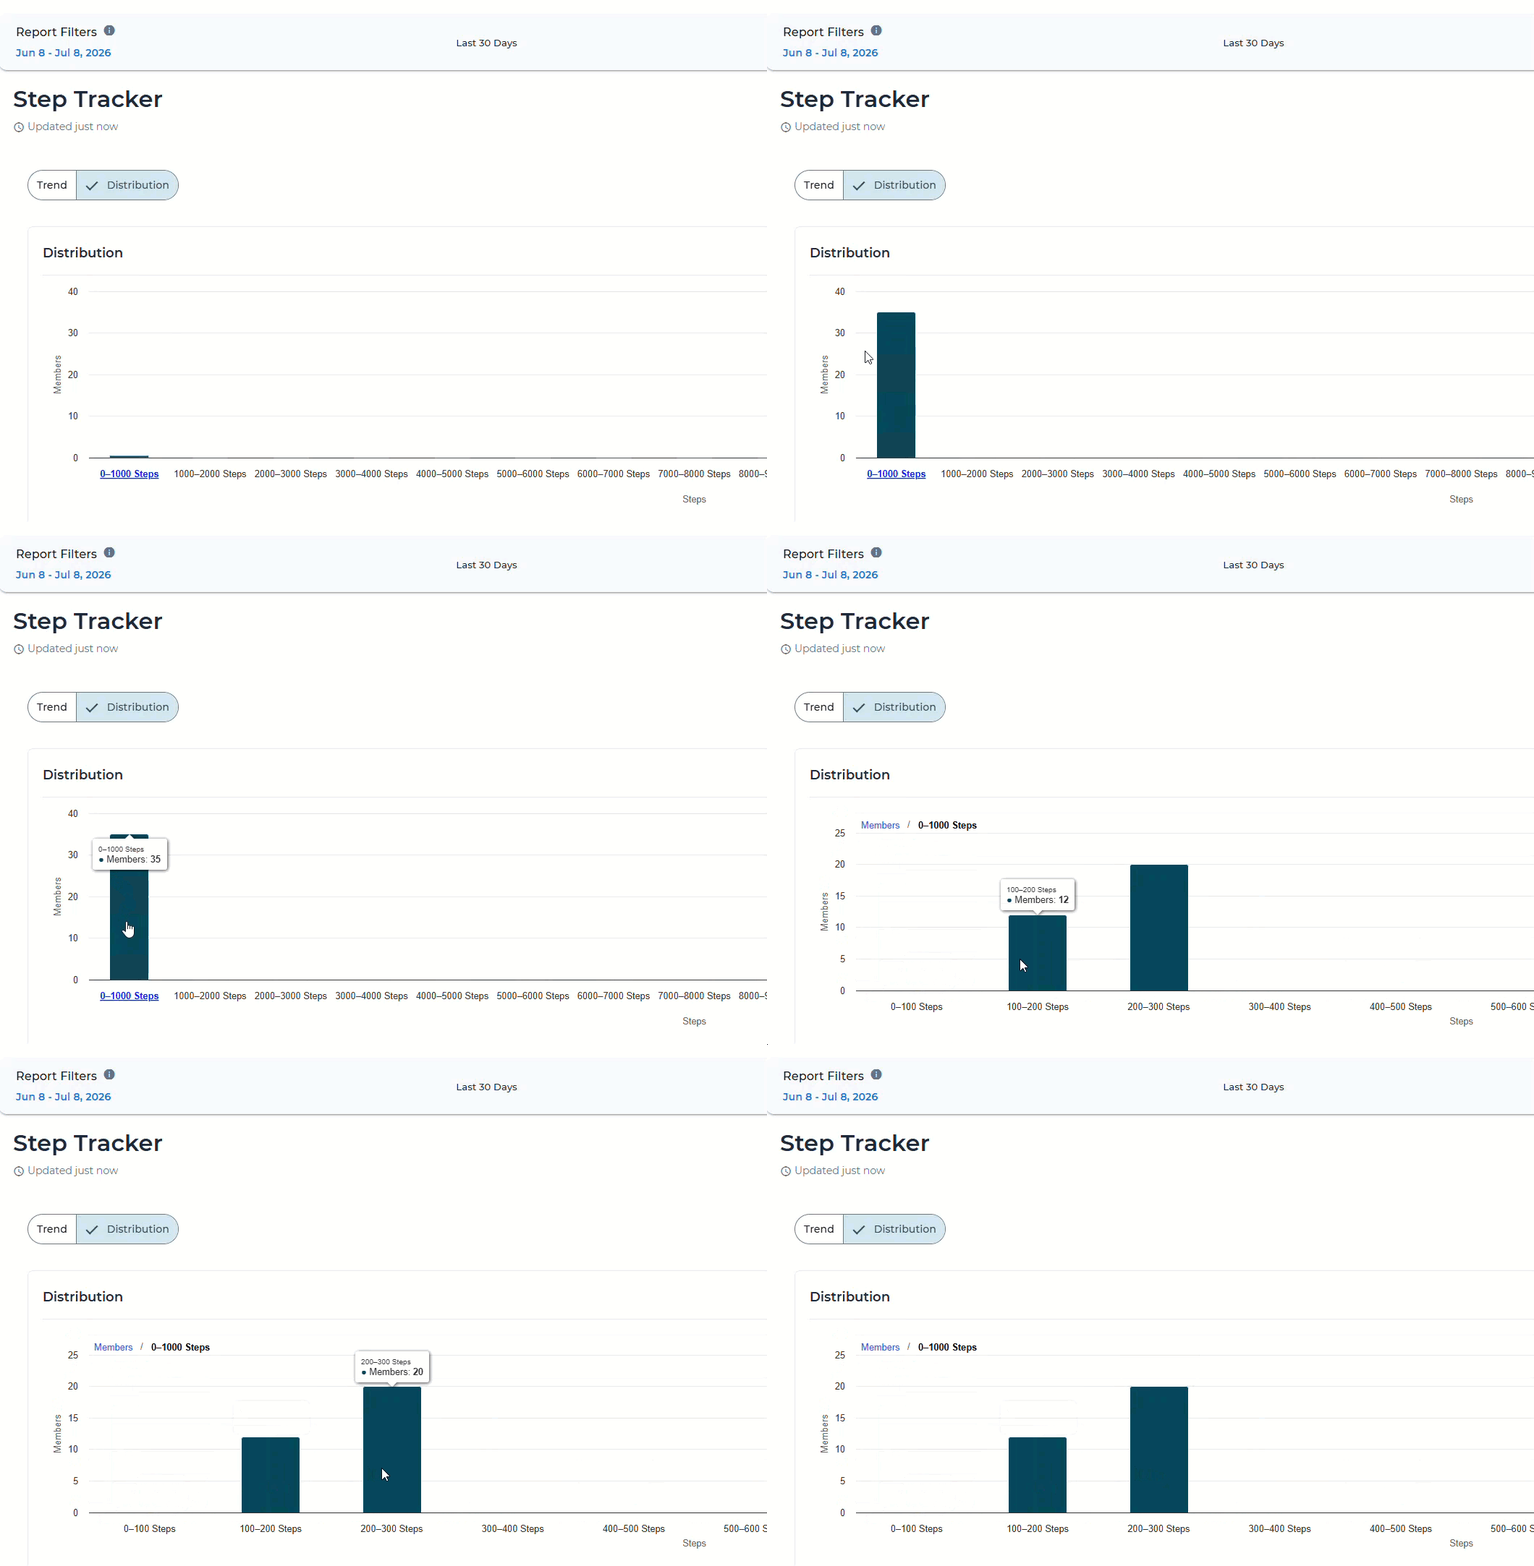
Distribution charts in Tracker Report have always shown range-type questions as aggregated buckets, a fast read, but a dead end if you wanted to see what was actually inside one. Clicking a bucket now drills into it, breaking that range into a finer set of buckets so you can look closer without leaving the report.
What's Changing
1. Click-to-drill-down on any distribution bar
In Tracker Report → Tracker Details → Distribution, clicking a bar for any range-type question drills into that bucket's data, breaking a wide range like 0–1,000 steps into narrower buckets like 0–100, 100–200, and so on.
2. Applies wherever range-type questions are aggregated
This isn't limited to a single tracker; it works across any range-type question the Distribution chart buckets into ranges, so the behavior stays consistent no matter which tracker you're reviewing.
Why It Matters
More detail without leaving the chart — Narrow in on a bucket to see a finer breakdown, no export or separate report required.
Easier to spot where the story is — A bucket that stands out becomes something you can explore instead of a flat end point.
One consistent pattern across trackers — Drill-down works the same way everywhere a distribution chart aggregates range-type data, so there's nothing new to learn tracker to tracker.